Dashboards
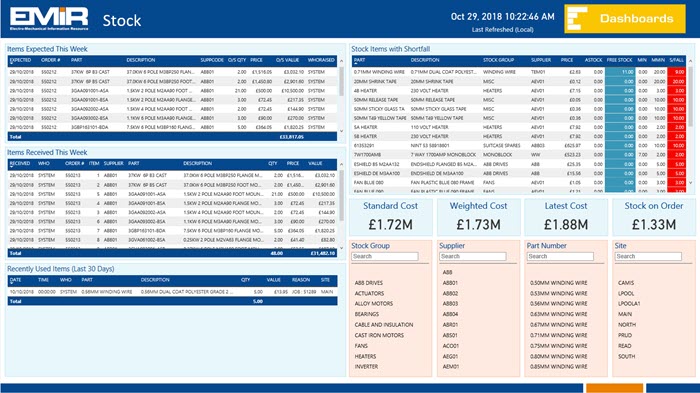
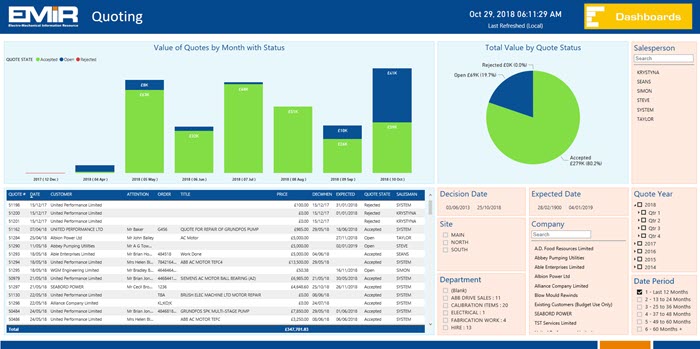
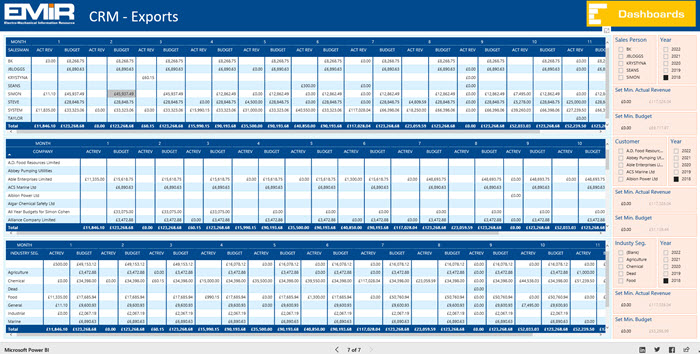
Dashboards are the latest Extension in the EMiR product range. Using Microsoft's reporting tool Power BI, Dashboards collate information from the EMiR database to create a range of easy-to-use visual reports that can be distributed and viewed on the desktop or mobile device of selected users.

The way you interpret information within your business greatly affects the outcome of decisions that are made. Poor quality or incomplete reports will often lead to delays in decision making or inaccurate outcomes.
With this in mind, we have adopted Power BI by Microsoft to create a range of interactive dashboards that display information both graphically and analytically, and can be instantly interrogated by the user to identify the detail behind the summary information.
EMiR Dashboards are refreshed on a timed basis to ensure the information reflects the latest trends and transactions that EMiR is holding. The information in the Dashboard can be exported for further analysis in spreadsheets, for mailmerging and email marketing.
Why not give it a go?
Click the pictures below to see for yourself.
Try selecting different information in the light orange panels - the options are endless!
Dashboard don't only come in this standard format, they can be tailored to the specific needs of your business - give us a call on 0845 009 4588 or email info@solutionsinit.com
Click the link below to download our brochure '5 Decisions made easier with EMiR Dashboards'


